
I kept running into the same problem with trading ideas. An indicator looks perfect on a chart, you convince yourself it has an edge, and then you find out the “edge” was just the market going up the whole time. I wanted a way to answer one question honestly: does this signal actually beat buying and holding, or does it only look good in hindsight? WeissWave is what I built to answer it.
This did not start from an indicator I downloaded. I spent a long time reading the original Richard D. Wyckoff, learning how he weighed volume against the price move it actually produces, and only once I understood the core concepts did I build my own studies in TradingView around the parts that held up. Those custom Pine Script studies, a WaveTrend and volume engine and a Weis Wave reader, are the foundation, and the signal suite I rely on most came out of my own testing rather than anyone else’s playbook.
Porting all of it to Python, with the Pine Script as my reference, was the next step. But the port was the mechanical part. The real work was figuring out what was worth encoding in the first place, and then building the layer around it that turns those signals into strategies you can test the way a skeptic would.
What it does
The whole thing is a pipeline, and each stage exists to keep the next one honest.
First it turns every idea from the original scripts into a plain true/false column, aligned to each bar and only true when you could have actually known it at that bar’s close. That last part matters more than it sounds. A divergence signal, for example, only fires on the confirmation bar two bars after the pivot, not on the pivot itself the way a chart draws it after the fact.
Then an event study measures each signal on its own. For every signal it looks at the forward return over the next 1, 3, 5, 10, and 20 bars across the whole S&P 500 and compares it to the return of all bars generally. A signal only earns a spot in a strategy if it shows a real edge by itself.
From there a two stage strategy finder does the heavy lifting. Stage one scores every reasonable combination of entries, regime filters, and strictness on a training slice of history. Stage two takes only the survivors and fully simulates them across a grid of exits, stops, and hold times, on the training half and the test half separately. The training columns tell you what looked good. The test columns are the honesty check. Anything that falls apart between the two was luck.
The honesty check
This is the part I care about most. Every backtest and every finder result is measured against an equal weight buy-and-hold version of the same universe over the same dates. For each trade it computes the excess, which is just the trade return minus what the market did over the exact same holding window.
The finder ranks strategies by their average training excess, so a strategy can only rank highly if it actually beat holding the market, not just made money while the market made more. The backtest view shows the market’s return for the window, the average excess per trade, and the beat-the-market rate, and it warns you outright when buy-and-hold would have won. A strategy that makes 12 percent while the index made 15 is a losing strategy, and the tool says so instead of hiding it.
No peeking at the future
There is a subtler way a backtest can lie to you, and it fooled me for a while. A lot of tools let an indicator use information from bars that had not happened yet at the moment of the trade. The clearest example is a repainting signal. On a live chart the arrow looks like it showed up right at the low, but the indicator actually needed the next couple of bars to confirm that low before it could draw the arrow at all. If your backtest enters on that arrow, you are trading on something you could not have seen in real time, and the results look incredible for a reason that never survives contact with a real account.
WeissWave treats that as the cardinal sin. Every signal is built to be true only when it was knowable at that bar’s close. A divergence fires on the confirmation bar two bars after the pivot, not back-dated onto the pivot the way the chart paints it after the fact. Entries fill at the next bar’s open, never at the close of the bar that produced the signal. If the information was not available yet, the strategy does not get to use it.
Proving the fills are real
Most backtests fake the intrabar path. They assume your stop or your exit filled at some price without any evidence it ever traded there. I did not want to trust results built on that guess, so the backtest replays every trade against real 15 minute, 5 minute, and 1 minute bars stored in the database. Entry fills, exit fills, and stop touches all get re-derived from those fine bars and compared against the coarse daily model.
The result is a per-trade discrepancy table, an overall bias number, and a chart that shows the fine bars around any single trade with the modeled fill and the verified fill marked side by side. When the fine data does not go back far enough, and Yahoo only serves about 55 days of 15 minute bars and 7 days of 1 minute, the trade is reported as unverifiable rather than quietly guessed at.
How it is built
The engine is a small Python package with one job per file: the indicator math, the Weis Wave state machine, the divergence detection, the signal table builder, the strategy search, the backtester, the fill verifier, and a data layer. It leans on nothing but pandas and numpy for the math, partly on purpose, since the popular technical-analysis library is broken on current numpy and I did not want a dependency I could not trust.
Storage is DuckDB, and the design goal was that a fetch can never corrupt or duplicate what is already there. One table, a primary key on symbol plus interval plus timestamp, and every write is an insert-or-replace. Overlapping fetches overwrite instead of duplicating, and a failed run never destroys existing data because nothing is ever cleared.
def upsert_prices(con, df):
    """Insert-or-replace price rows keyed on (symbol, interval, ts)."""
    df = df[PRICE_COLS].copy()
    df["fetched_at"] = datetime.now(timezone.utc).replace(tzinfo=None)
    con.register("incoming", df)
    con.execute(f"""
        INSERT OR REPLACE INTO prices ({", ".join(PRICE_COLS)}, fetched_at)
        SELECT {", ".join(PRICE_COLS)}, fetched_at FROM incoming
    """)
    con.unregister("incoming")
That upsert is why the newest daily bar behaves. During market hours the data feed hands you the live session as a partial bar, and after the close the same day comes back complete. Both normalize to the same key, so the finished bar simply replaces the partial one. Every incremental run also refetches a few days of overlap because the newest bars are the least trustworthy, and the upsert corrects them in place.
Strategies themselves are just boolean expressions over the signal columns, which keeps them readable and easy to combine:
wt_exit_oversold & recent(volume_cross_up, 3)The data source is abstracted behind one class. Yahoo is the default for daily history, and an Alpaca provider pulls SIP intraday data with split and dividend adjustment when I want depth. Its credentials come from HashiCorp Vault at runtime and never touch the disk, which ties this project into the same secrets setup I run across my home lab. A separate signal cache computes full-history signals once per database update and reuses them, so a backtest that used to take 90 seconds now runs in 3 to 5.
The direction this is heading matches how I actually think about a trade. You use the higher timeframe to read the trend, then you dial down to a lower timeframe to time the entry. The daily chart decides whether you should be looking to buy at all, and an hourly or faster chart decides exactly when. A cross-timeframe gate makes the simulator work that way on purpose: it only takes a lower-timeframe entry while the higher-timeframe trend is in force, and it shifts that trend by one bar so the gate obeys the same no-lookahead rule as everything else. On top of it a portfolio simulator models finite capital, a position cap, and a compounding equity curve against the benchmark, which is the bridge between a signal having an edge and an account actually growing.
Owning the whole stack
The signals in this project are mine, and they did not start in Python. I wrote them by hand in Pine over a long stretch of time, one study at a time, building up the wave and volume logic, the pattern detection, and the divergence rules until I had a system I understood at the level of every line. Then I ported that whole library into Python myself, by hand, so it would run on my own data and my own terms instead of inside a charting website.
For a while the one piece I did not own was the fast backtesting engine. I leaned on VectorBT Pro, a paid monthly library, for a few specific functions that would have been slow or fiddly to write from scratch, the pattern-similarity search chief among them. It worked, but it meant the fastest part of my process sat on top of a closed-source subscription I was renting, and I wanted the whole stack to be mine, engine included.
Replacing it made things briefly worse before they got better. A hand-written loop over the same data is far slower than a compiled library, and it is also a good place for subtle bugs to hide. One force-closed every trade after a fixed number of bars, quietly dumping winners in the middle of a run. Another exit rule silently never ran at all. For a stretch the backtester was confidently telling me a strategy lost money when the real problem was a stop placed inside the day’s normal noise, or a bug in my own exit code. A backtester that lies to you is worse than not having one, so I fixed it properly instead of papering over it.
The simulation now runs as a single compiled loop over a two dimensional grid, time down one axis and every symbol across the other, which is the same shape the paid libraries use internally. I studied how they structure it and wrote my own version, owned outright, backed by hand-built test cases where I already know the right answer. An entry has to fill on the next bar’s open. A stop has to fill at the stop price, or at the open when price gaps straight through it. A trade can never use information from a bar that comes after it has exited. The account can never create or destroy money. If any of that breaks the tests fail loudly, and the engine reproduces my earlier results to the dollar, so I know the speed did not come from quietly changing the math.
Building the signals for the whole universe is the only slow step now, and I pay it once. After that I can sweep thousands of exit configurations in about the time a single run used to take. Owning the engine is what makes that possible, and it means the strategy, the signals, the data, and the code underneath are all mine, hand-built, fast, and tested, with nothing in the loop rented or hidden.
Knowing when not to trade
A fast, honest backtester is only worth having if you let it tell you things you did not want to hear. The hardest one to accept is that a lot of active trading loses to simply buying good setups and holding them. So I built that comparison into the core of the tool. Every configuration I test is scored against just holding the same stocks it traded over the same stretch of time, and the results are ranked by how much they beat that baseline. A setup that cannot beat holding is not a strategy, it is effort I could have skipped.
I also stopped trusting any single result. It is easy to find a setting that looks brilliant on one slice of history and falls apart the moment the market changes character. So the tool now splits the full history into separate periods, tunes on some of them, and scores on the ones it never saw. A setting only earns my attention if it holds up across bull runs, crashes, and the quiet years in between, not just the one window that happened to flatter it.
Underneath, nothing is fixed in place anymore. Trend, volume, divergence, how far price has stretched from its base, how close it sits to a level that has mattered before, each one is a dial with a weight, and a trade only fires when enough of them agree. A promising idea that is not quite right gets tuned instead of thrown away, and the search can be pointed at the whole space of combinations to find the one that holds up, rather than me guessing at it by hand.
Pointed at large trending stocks, the honest answer came back plainly: hold them, do not churn them. The edge was in choosing them, not in trading them. So I pointed the same tool at a more volatile market by pulling in years of crypto price history, and the answer flipped. In a market that regularly falls seventy percent, sitting through the drawdown is the expensive choice, and a strategy that steps aside and comes back held up across every period I tested where holding did not. Same engine, same tests, opposite and equally honest conclusions. The value was never that it found a winner. It is that I can trust it when it points at where an edge is, and just as much, where one is not.
Trades as receipts
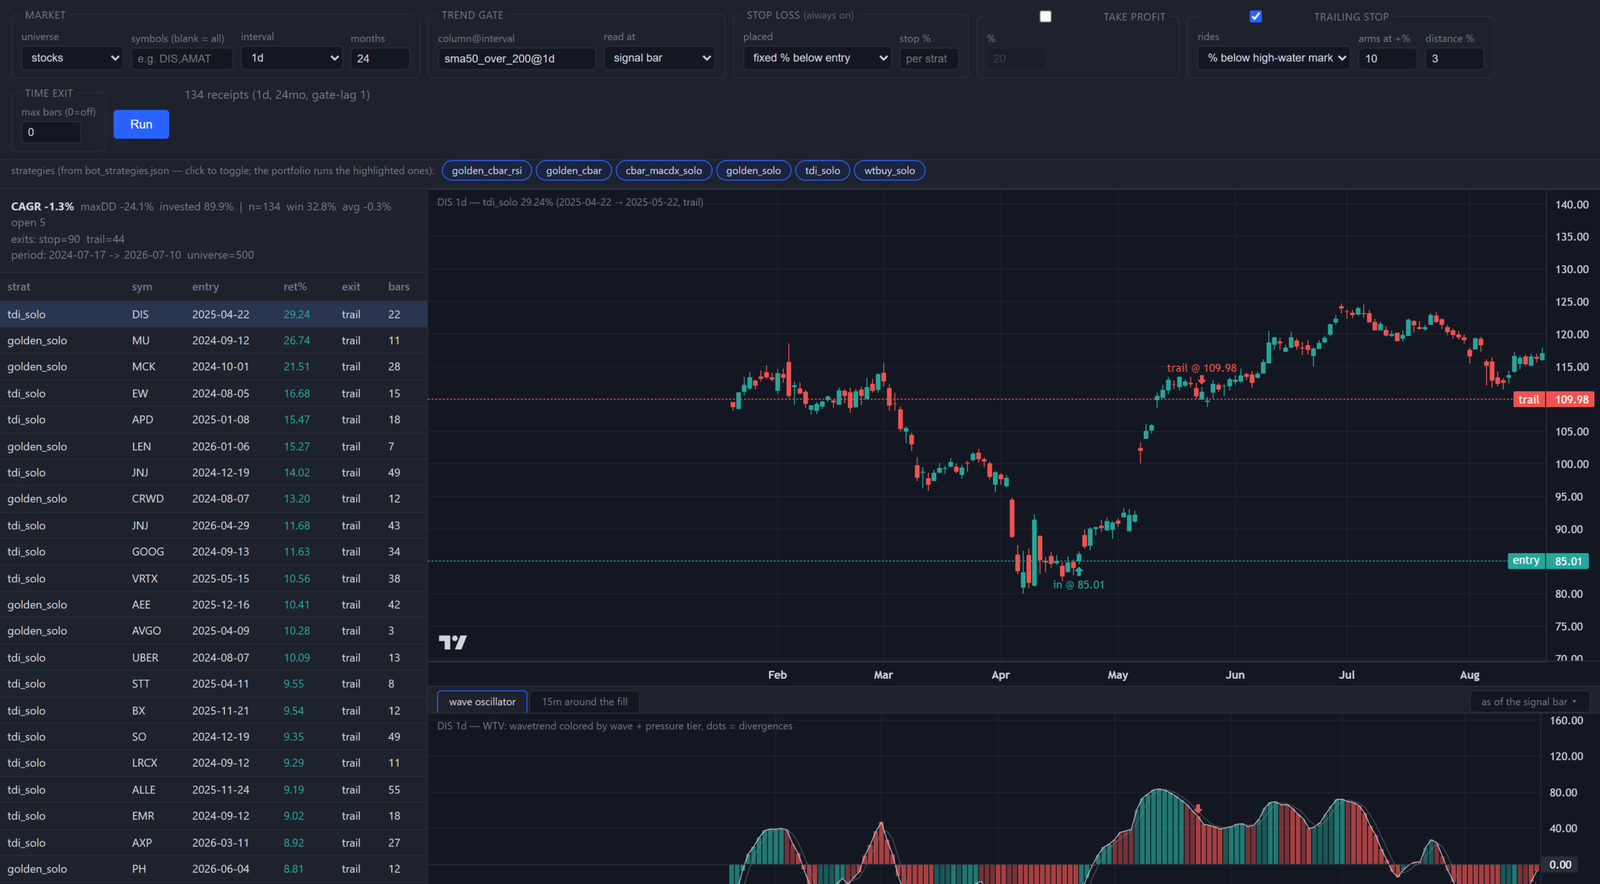
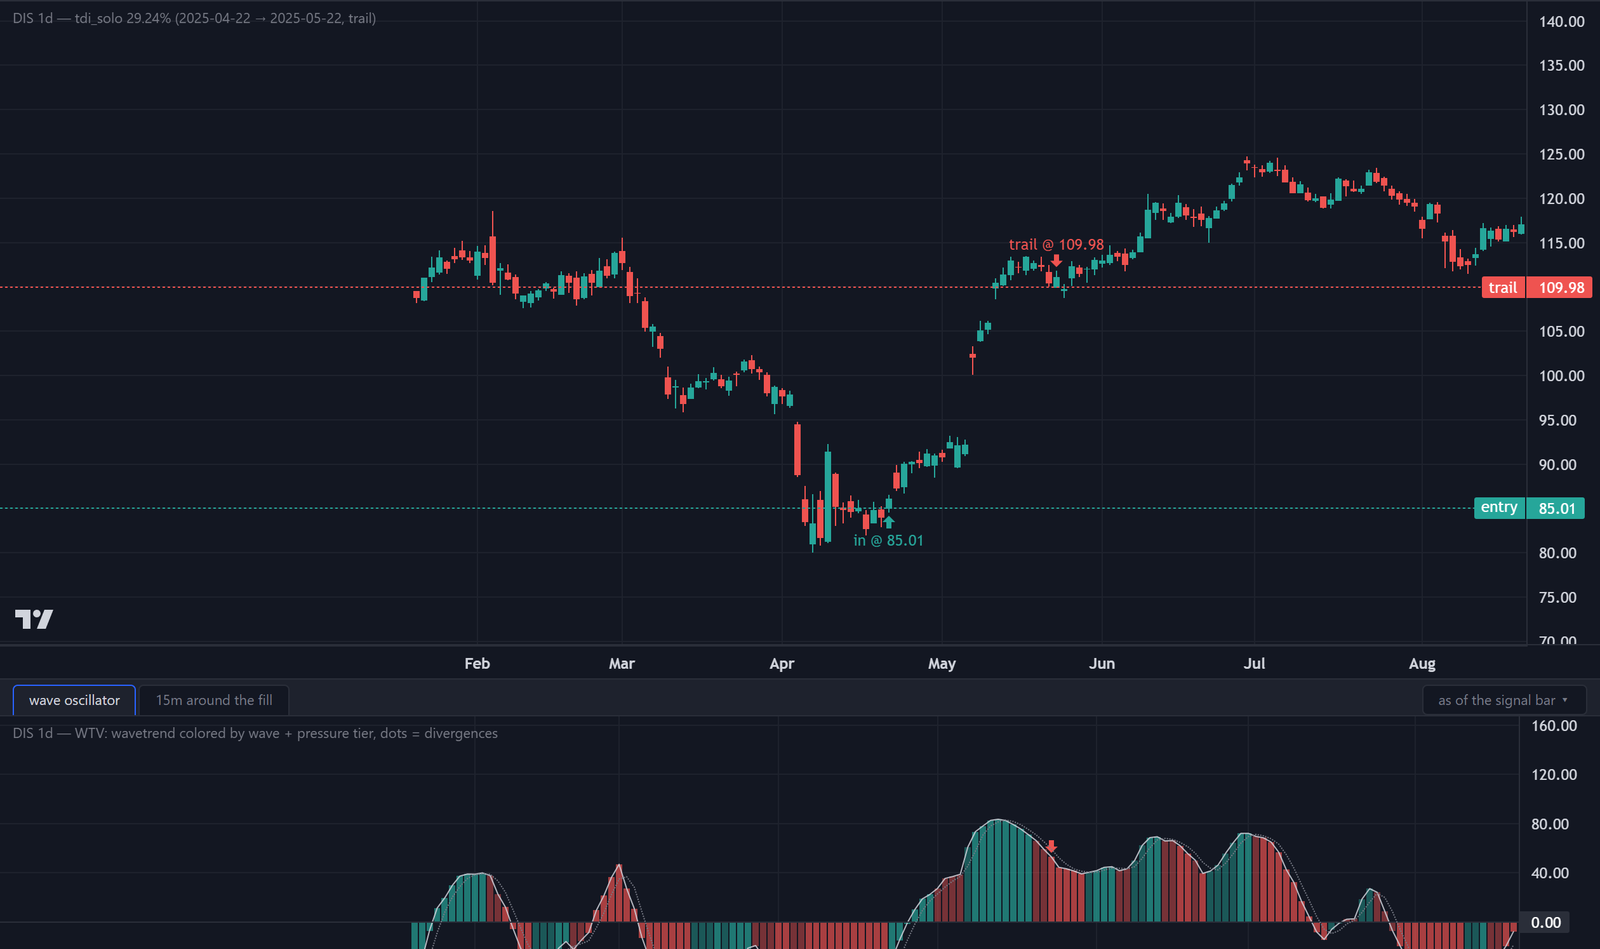
The newest layer is a web front end built around a simple rule: every trade a backtest claims is a receipt, and a receipt has to name its exact spot on a chart. Pick a configuration, run it, and every row in the results is a real trade with an entry date and fill price, an exit and the reason for it. One click puts the arrows on the candles, and under the price pane sits my wave volume oscillator, drawn the way I wrote it in Pine and locked to the same time axis. If a trade looks wrong I can pull the same date up on TradingView and check it by eye. That loop has already caught real bugs the automated test suites missed.
The inputs read like a broker ticket now. A stop loss is always on, take profit and trailing stop are checkboxes with plain percentages, and the platform refuses a half filled setting instead of quietly running something else. Behind it sits a replay check that hands the engine only the bars that existed at each moment and asserts it says the same thing live as it does in hindsight, for every one of the hundred plus signal columns. Chart platforms are notorious for backtests that paint signals a bar after the fact, at prices nobody could have traded. This one proves it does not. The front end itself is a small FastAPI server and TradingView’s open source charting library, so the charts read exactly like the ones I trade from.
Keeping the edge private
The public repository runs on the open signal set: the standard textbook signals and the WaveTrend and Weis Wave ports. The experience-driven signal suite that I actually rely on lives in one file that is excluded from the repo. The package detects its absence and runs cleanly without it. The framework is worth sharing. The specific edge is not, and separating the two was a design decision from the start.
Checked against other engines
A backtester that grades its own homework is easy to fool, so the newest trust layer makes mine defend its results against engines I did not write. The same textbook strategies, MACD, golden cross, and RSI pairs, ran through my engine and through backtesting.py on byte-identical bars with shared signal columns. Across 516 symbols the two engines produced 38,453 closed trades, and every single one matched: entry time, exit time, both fill prices, and the return. The replay audit re-ran the whole universe while handing the engine only the bars that existed at each moment, 7,156 probed bars across all 126 signal columns, and found zero repaints. The same checks now pass on minute bars as well.
Then I pointed the protocol at TradingView, whose strategy tester is where most trading ideas get their first false confidence, mine included. Same simple moving average cross rules, same symbol, both testers pinned to the same next-open fill convention. Every trade both testers listed agreed to the penny on fills and to a hundredth of a percent on returns, which says the two simulations implement the same contract. But their list was missing five trades my engine took, including the biggest winner of the whole set, a hold from March 2019 to March 2022. The moving average gap that spring opened to eleven dollars, so the crossover exists on any data feed. Their engine saw it and did not trade it, and I still do not know why, because the trade list export that would let me diagnose it sits behind a paid tier. My receipts are free, complete, and auditable down to the fill price. That is the point of owning the stack.
Sharpening the engine
The engine also got a measured performance pass, with a baseline harness that records wall time and memory for standard runs so a regression shows up as a flagged number instead of a feeling. Prepared signal grids now live as memory mapped files that every worker process shares, one physical copy for the whole machine, which cut a third off the portfolio run’s wall time, and multi worker searches now share grids that used to be copied into every process. Sweeping an exit configuration over a cached grid costs about fifty milliseconds, so a question like which trailing stop actually survives is a coffee break, not an overnight job.
Exits stopped being one size fits all. Every exit parameter, the stop, the target, the trailing stop’s activation and distance, the time cap, can now scale per trade with how strong the entry evidence was. The slope is a searched value and it is allowed to be negative, because whether a high conviction entry deserves more room or less room is a question to measure, not an assumption to bake in. Every receipt records the confidence and the exact exit parameters that trade actually ran, and a knob that cannot move anything says so out loud instead of running silently.
Results graduated from a folder of files to an evidence ledger. Every stored run carries its settings and a fingerprint of the exact data it saw, an integrity audit verifies each recorded artifact still exists byte for byte, and a review mode lets me step through every claimed trade on the chart with keyboard labels, building a hand checked record of which setups I actually believe. The search can also run without me now: a local language model proposes configurations overnight, the platform executes them behind all of the honesty rails above, and every rejection comes back categorized. The first supervised session scored 249 configurations in under four minutes and rejected every one of them, each with a stated reason. An honest zero beats a flattering maybe, and this tool is built to keep saying so.
Where it stands
WeissWave is the tool I use to decide whether a trading idea is worth trusting with real money. It is deliberately built to talk me out of bad strategies, which is the opposite of what most backtesting software does. The framework is on GitHub. The proprietary strategy logic is not, and it stays that way.
Code: github.com/grafman56/WeissWavePub
More detail: Building a Stock Screener I Can Actually Trust and From Pine Script to a Python Trading Platform.